

In today’s rapidly evolving digital landscape, businesses are inundated with data, and the ability to harness this data effectively is no longer a luxury—it’s a necessity. Navigating the sea of analytics options can be overwhelming, leaving many business leaders asking: “What is the difference between business analytics and data analytics?”
Understanding this distinction is crucial for leveraging the full potential of your data to make informed decisions and drive growth. Business analytics and data analytics may sound similar, but they serve distinct purposes and offer unique insights. While both revolve around data, business analytics focuses on leveraging data to improve business performance and strategic decision-making. On the other hand, data analytics dives deeper into the technical trenches, analyzing data sets to uncover patterns and underlying truths. Unpacking these differences not only equips you with the knowledge to optimize processes but also empowers your team to carve out competitive advantages in an increasingly data-driven world. Dive with us into the intricacies of these essential tools to see how they can transform your business strategies.
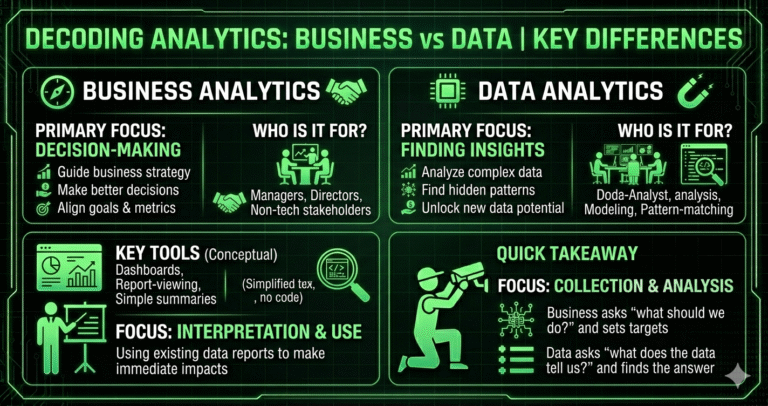
Business analytics and data analytics are two closely related but fundamentally different disciplines. The easiest way to understand the distinction is to think about the primary question each one answers.
Business analytics asks: “How can we use our data to make better business decisions and improve performance right now and in the future?”
Data analytics asks: “What patterns, trends, and insights exist inside our data?”
Business analytics is outward-facing and action-oriented — it connects data insights directly to business goals, KPIs, revenue, cost reduction, customer satisfaction, and strategic planning. Data analytics is inward-facing and discovery-oriented — it focuses on extracting meaning from raw data, regardless of immediate business application.
Core differences in 2026:
| Dimension | Business Analytics | Data Analytics |
|---|---|---|
| Main Goal | Drive better business decisions & outcomes | Discover patterns, trends & insights in data |
| Primary Audience | Executives, managers, department heads | Data scientists, analysts, researchers |
| Time Orientation | Mostly forward-looking (what should we do next?) | Mostly backward-looking (what happened & why?) |
| Typical Output | Dashboards, forecasts, recommendations, action plans | Statistical models, correlations, visualizations |
| Business Impact Focus | Directly tied to revenue, cost, customer metrics | Indirect — provides foundation for business decisions |
| Tools Commonly Used | Power BI, Tableau, Looker, Google Data Studio | Python (pandas, scikit-learn), R, SQL, Jupyter |
Real-world analogy: Data analytics is like a detective examining clues at a crime scene — collecting evidence, finding patterns, reconstructing what happened. Business analytics is like the police chief deciding what actions to take based on the detective’s report — deploy more officers here, change patrol routes there, prevent future crimes.
In practice the two disciplines overlap heavily. A good data analyst understands business context; a good business analyst knows enough technical detail to ask smart questions. But the focus remains different: data analytics seeks truth in data; business analytics seeks value from that truth. Understanding this distinction helps organizations build the right teams, choose the right tools, and ask the right questions — ultimately turning raw data into real business results.
Business analytics exists to turn data into decisions that improve performance, reduce risk, and create competitive advantage. In 2026 almost every forward-thinking company uses business analytics to answer questions that directly affect the bottom line.
Typical business analytics questions being answered daily:
Business analytics delivers value through four main lenses:
In practice, business analytics teams create:
Companies that master business analytics consistently outperform competitors — they spot opportunities faster, react to threats quicker, allocate resources smarter, and understand customers better. In 2026 business analytics is no longer a “nice-to-have” department — it is a core driver of strategy and profitability across industries.
Data analytics is the technical discipline of extracting meaning from raw data. It focuses on discovering patterns, relationships, anomalies, and truths that are hidden inside datasets — regardless of immediate business application.
Main categories of data analytics techniques in 2026:
Most popular tools used by data analysts in 2026:
| Category | Tools | Primary Use |
|---|---|---|
| Programming | Python (pandas, NumPy), R | Data manipulation, modeling |
| Visualization | Tableau, Power BI, Looker, Plotly | Interactive dashboards & reports |
| Notebooks | Jupyter, VS Code + notebooks, Google Colab | Exploration & prototyping |
| SQL | BigQuery, Snowflake, PostgreSQL, MySQL | Data extraction & aggregation |
| Big Data | Spark (PySpark), Databricks, Snowflake | Processing terabytes of data |
Data analysts spend their days asking questions like: “What patterns exist in customer behavior?”, “Which variables predict churn?”, “Are these sales drops random or systematic?”, “How do different customer segments behave differently?”. Their output — cleaned datasets, statistical models, visualizations, and documented findings — becomes the raw material that business analysts turn into actionable recommendations. Good data analytics provides the “what” and “why”; business analytics provides the “so what” and “now what”.
Business analytics plays a central role in strategic planning by providing evidence-based answers to high-stakes questions: Where should we invest? Which markets/customers/products deserve more attention? How should we allocate budget next year? What risks should we prepare for?
Typical strategic questions answered by business analytics in 2026:
Business analytics contributes to strategy through:
Companies that integrate business analytics deeply into strategic planning consistently outperform peers. They spot emerging trends earlier, reallocate resources faster, avoid costly mistakes, and capitalize on opportunities before competitors. In 2026 strategic planning without strong business analytics is considered high-risk — almost reckless — in data-rich industries.
Data analytics is the technical engine room of insight generation. It involves collecting, cleaning, transforming, modeling, and interpreting data to uncover patterns and truths that inform business decisions. While business analytics focuses on “so what” and “now what,” data analytics focuses on “what exactly is happening in the data?”
Core activities in modern data analytics (2026):
Most common tools used by data analysts in 2026:
| Category | Popular Tools | Primary Purpose |
|---|---|---|
| Programming | Python (pandas, NumPy), R, SQL | Data manipulation & modeling |
| Visualization | Tableau, Power BI, Looker, Plotly | Interactive dashboards & reports |
| Notebooks | JupyterLab, VS Code notebooks, Google Colab | Exploration & sharing |
| Big Data | Spark (PySpark), Databricks, Snowflake | Processing large datasets |
| Experimentation | Optimizely, AB Tasty, Statsmodels, SciPy | A/B testing & statistical analysis |
Data analysts spend their time asking questions like: “What is the true conversion rate by channel?”, “Which variables most strongly predict customer lifetime value?”, “Are these unusual transactions fraud or legitimate?”, “How has customer behavior changed after the new website launch?”. Their output — clean datasets, statistical findings, visualizations, and documented insights — becomes the foundation that business analysts use to make recommendations and drive decisions. Strong data analytics ensures decisions are based on reliable evidence rather than assumptions or incomplete pictures.
Business analytics delivers maximum value when it is deeply embedded into daily operations — not treated as a separate “analytics department” that produces occasional reports. In 2026 leading companies integrate business analytics directly into workflows so insights reach decision-makers in real time.
Ways organizations embed business analytics into operations:
Real-world operational examples in 2026:
Companies that integrate business analytics into daily operations report faster decision-making, fewer surprises, lower costs, and higher customer satisfaction. In 2026 treating analytics as an operational layer — rather than a periodic reporting function — is a key differentiator between market leaders and followers.
Data analytics includes several maturity levels — descriptive (what happened), diagnostic (why it happened), predictive (what will happen), and prescriptive (what should we do). Predictive and prescriptive analysis represent the highest-value layers because they move from explanation to foresight and action.
Predictive analytics answers “what is likely to happen?”
Prescriptive analytics goes one step further: “given what is likely to happen, what is the best action?”
Tools commonly used for predictive & prescriptive work in 2026:
| Level | Common Tools | Example Use Case |
|---|---|---|
| Predictive | XGBoost, LightGBM, CatBoost, Prophet, ARIMA, TensorFlow | Churn probability scoring |
| Prescriptive | Optuna, Gurobi, CPLEX, OR-Tools, Pyomo | Optimal pricing & assortment |
| Both | AutoML (H2O, DataRobot, Google Vertex AI) | Automated model selection & tuning |
Predictive analytics tells you the future; prescriptive analytics tells you how to shape it. Companies that master both gain significant competitive advantage — they don’t just react to trends; they proactively create better outcomes. In 2026 the gap between leaders and followers is increasingly the ability to move from predictive insight to prescriptive action at speed and scale.
Business analytics and data analytics are complementary disciplines that together turn raw data into real business value. Data analytics uncovers what is happening and why — providing the factual foundation. Business analytics translates those facts into decisions and actions that improve performance, reduce risk, and create competitive advantage.
In 2026 successful organizations no longer treat analytics as a separate function — they embed both data and business analytics deeply into daily operations, strategic planning, and decision-making at every level. They use self-service tools so managers can explore data themselves, real-time dashboards so leaders see performance instantly, predictive models so risks are spotted early, and prescriptive recommendations so the best actions are clear.
The companies that master this integration consistently outperform their peers — they spot opportunities sooner, allocate resources smarter, react faster to changes, understand customers better, and innovate more effectively. The distinction between business analytics and data analytics matters because it helps organizations build the right teams, choose the right tools, and ask the right questions.
Whether you are a business leader looking to drive growth, a manager wanting better visibility, or an analyst aiming to deliver maximum impact — understanding and combining both disciplines is the key to turning data from a cost center into a strategic asset. The future belongs to organizations that don’t just collect data — they use it intelligently to make better decisions every single day.
Check out our Data Analytics Training Course in Dubai, Our institute Orbit Training Center